Pro-grade charts
for every trader
Analyze stocks, crypto, and more on one lightning-fast platform. Advanced drawing tools, customizable indicators, and multi-timeframe analysis all in your browser or app.
No credit card required · Free tier forever · See Pro plans
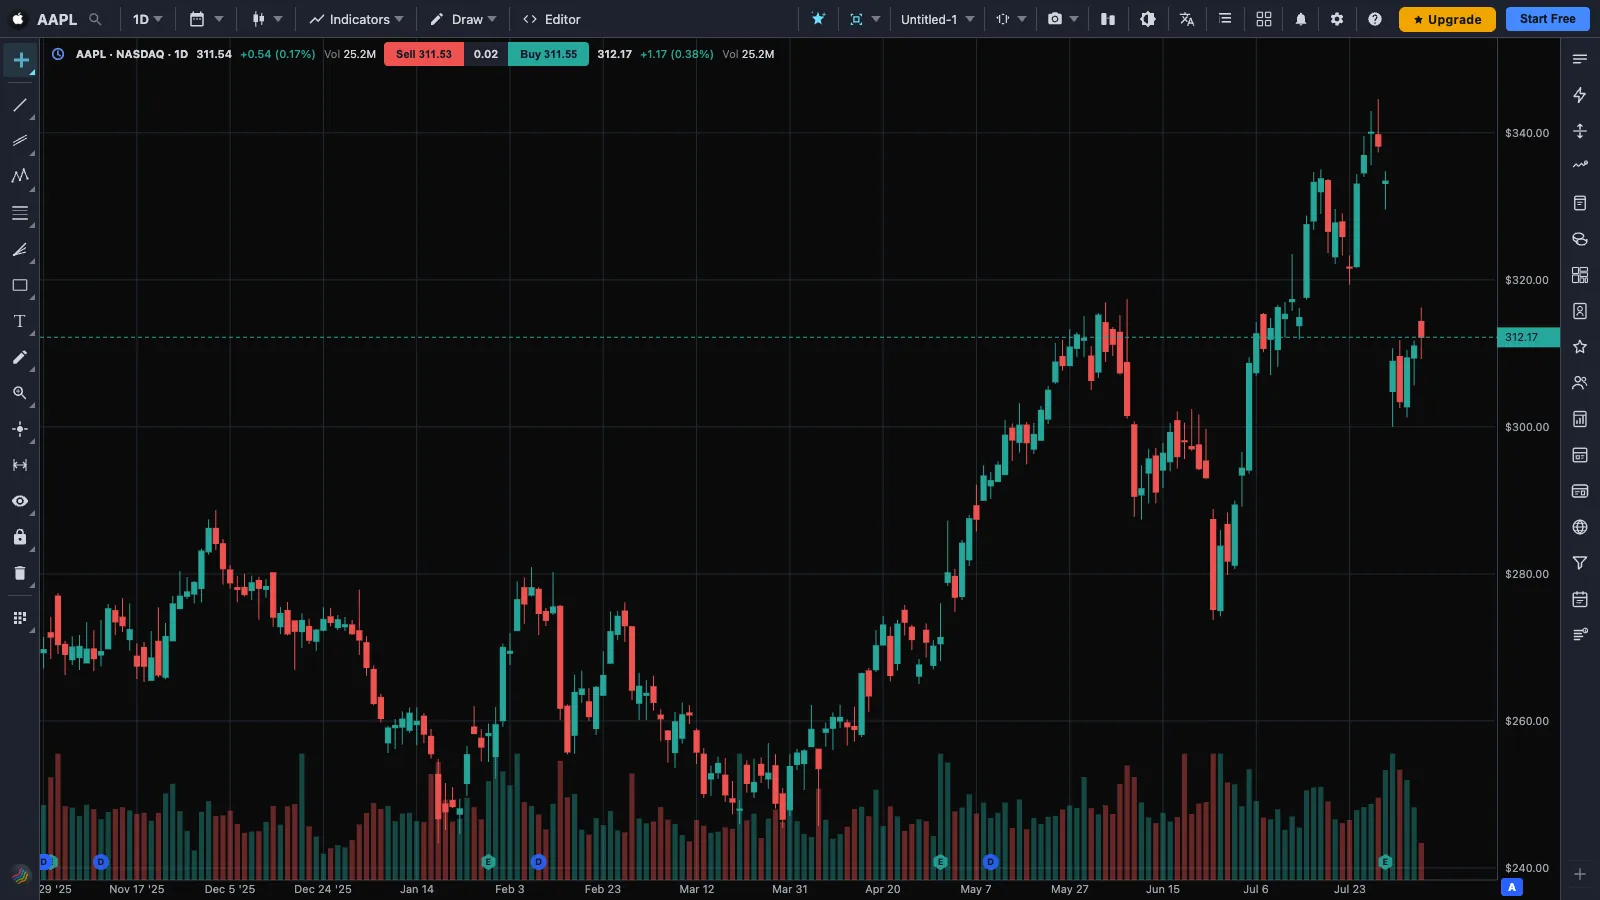
23 chart types.
38 timeframes.
From standard candles to Renko, Kagi, Market Profile, and Volume Footprint. Timeframes from 1-second and tick bars to 12-month bars.
Every chart style
Candles, Heikin Ashi, Renko, Kagi, Point & Figure, Line Break, Range Bars, Market Profile (TPO), Session Volume Profile, Volume Footprint, and more.
Sub-second to yearly
38 timeframes including seconds (1s to 45s), tick bars (1-1000 ticks), range bars, minutes, hours, days, weeks, and months.
Real-time streaming
WebSocket-powered live quotes with sub-second updates. Pre-market and after-hours data (4 AM to 8 PM EST).
Themes & 137 settings
Dark, light, Classic, Colorblind, B&W, and Ocean presets plus gradient backgrounds. 137 searchable settings with live preview, in 19 languages.
Global data feed
Real-time streaming for US stocks and crypto, plus 15-minute delayed data for global markets. Connect your broker account for real-time streaming anywhere via Bring Your Own Data.
507 indicators.
134 auto-detected patterns.
The largest built-in indicator library for any browser-based platform, and an open-source marketplace on top of it. Stack, customize, and overlay them freely.
507 built-in indicators
RSI, MACD, Bollinger Bands, VWAP, Stochastic, ADX, ATR, Ichimoku, and hundreds more across trend, oscillator, volume, and pattern categories. Fully adjustable parameters.
Pattern recognition
134 patterns auto-detected in real time, of 141 defined, including Doji, Engulfing, Head & Shoulders, Cup and Handle, VCP, flags, and wedges.
Multi-pane stacking
Overlay indicators on price or split into separate panes. Each gets its own scale, axis, and visual style.
Rotation & relative strength
Relative Rotation Graphs across 11 sector ETFs, SCTR technical rank, cross-symbol correlation, and year-over-year seasonal overlays.
Open-source marketplace
362 free community scripts on top of the built-ins: 279 indicators and 83 strategies, every one of them open-source. Install from the Marketplace tab in one click, read or fork the source, and publish your own.
Find the setup.
Know the company.
Scan the entire market with custom filters, then dive into the fundamentals before you trade.
Screener & Stock Picker
Custom filters with sortable results, plus a condition-based scanner across 8 universes with multi-timeframe agreement rules, 0-100 confluence scoring, and backtestable saved scans.
Financial statements
Income statement, balance sheet, and cash flow with multi-period trend charts. Compare quarters and years side by side.
Company profile
Company overview, leadership, ownership structure, SEC filings, analyst ratings, and insider trading activity.
Earnings & events
Earnings dates, economic calendar, dividend schedules, yield curves for 6 countries, and economic data for 190+ countries. Never get blindsided by a catalyst.
90+ drawing tools.
Pixel-perfect precision.
Mark up support, resistance, and your trade ideas. Every tool snaps to price and persists across sessions.
Lines & channels
Trend, horizontal, vertical, ray, extended, parallel channel, and regression lines.
Fibonacci & Elliott
Retracement, extension, arc, fan, spiral, timezone, wedge, plus Elliott Wave patterns.
Pitchfork & Gann
Standard, Schiff, and Modified Pitchforks. Gann Fan, Grid, and Square for geometric analysis.
Shapes & annotations
Rectangles, circles, polygons, text, callouts, price labels, arrows, pins, plus OpenMoji and 1,500 Lucide icons.
Drag blocks, not syntax.
Or write real Python.
A no-code visual builder and a modern in-browser Python engine, working on the same strategy. Build it visually, flip to code, keep editing either side.
No-code visual builder
Drag-and-drop node graph with 7 palette categories: 40+ indicator blocks, 19+ conditions, 14+ actions, plotting and logic. Wire them together and you have a backtestable strategy, with zero lines of code.
Real Python in your browser
Not a lookalike scripting language: actual Python with NumPy, Pandas, and 90+ TA functions, sandboxed in WebAssembly. No install, no API keys, no server. Pine scripts import and convert too.
Two-way builder-to-code sync
Every node graph generates readable Python you can open, edit, and run. Saved scripts come back as reusable nodes in the palette. Start no-code, graduate to code, never start over.
Risk management built in
Stop loss, take profit, trailing stop, Portfolio Stop, Portfolio Target, and Daily Loss Limit nodes. Plus ready-made Grid Bot and DCA Bot blocks with long, short, and neutral modes.
Backtest on deep history.
Then prove it holds up.
20+ years of daily history and automatic 15k+ bar deep fetches, with the full validation suite most platforms make you leave the browser for.
Deep history data
20+ years of daily bars with infinite scroll, and deep backtesting that auto-fetches 15k+ bars so intraday strategies are judged on a real sample, not the last few screens of price. Bar replay lets you step through any of it, bar by bar.
Realistic cost modeling
Flat and percentage commission, slippage and spread in basis points, leverage, bracket and OCO exits, and six position sizing models including Kelly, fixed ratio, and volatility target.
Monte Carlo, sweeps & genetics
Four resampling methods with risk of ruin, VaR and CVaR, and percentile equity bands. Grid, random, and Latin hypercube parameter sweeps with a fragility heatmap. Genetic optimizer with a Pareto front and walk-forward out-of-sample validation.
Strategy DNA & confidence
An 8-axis radar fingerprint and a 0-100 confidence score, plus monthly P&L heatmaps, R-multiples, regime splits, drawdown underwater charts, trade replay, and a what-if trade editor.
An analyst
on every chart.
Ask questions in plain English and get answers drawn straight onto the chart.
Chart assistant
Four providers to choose from: Gemini (free), Claude, ChatGPT, and Grok. Bring your own key or use the free tier.
Technical & fundamental analysis
Automated read of the current setup with indicators rendered inline, plus company fundamentals and earnings analysis.
Trade thesis & sentiment
Auto-generated bull and bear thesis with support, resistance, and catalysts. News sentiment heat layer overlaid on price.
MCP server
Connect Claude, ChatGPT, or Gemini directly to your account so they can analyze, research, and trade on your behalf.
Never miss a setup.
Embed anywhere.
Multi-condition alerts delivered everywhere. Embeddable widgets for any website or app.
Multi-condition alerts
Price crossing, channel breakout, volume spike, MA cross, watchlist, screener, pattern, and news alerts. 15+ fields, 16+ conditions.
Push, email & webhook
Get notified on your phone, inbox, or pipe alerts to Slack, Discord, or any HTTP endpoint.
28 side-panel widgets
Mini chart, watchlist, ticker tape, market movers, heatmap, news, quote, financial calendar, yield curve, and more. Embed any of them on your own site.
Export anything
Download OHLCV data as CSV, layouts as JSON, or generate PDF reports of your chart setup.
Chart it. Trade it.
All in one place.
Seamlessly integrated with the ai.tradegrub.com professional trading platform. Connect 15+ stock brokers and 100+ crypto exchanges for real-time trading.
Bring Your Own Data
Connect your brokerage account and route chart data through your broker API. Your data, your account, lower costs.
One-click trading
Place market, limit, stop, and bracket orders directly from the chart. Drag to adjust entries, stops, and targets. Time and Sales plus Level 2 depth included.
Paper trading
Practice with virtual funds on live market data. Test strategies and build confidence before risking real capital.
ai.tradegrub.com pro trading platform
Portfolio, dashboards, signals, journal, transactions, P/L, orders, insights, risk management, rebalancer, chat rooms, watchlists, stock/crypto information, and more.
Up to 16 synced charts.
One screen.
Build the workspace that fits your trading style. Save it, sync it, share it.
70+ grid layouts
Pre-built arrangements from 1 to 16 panels plus custom splits and drag-to-resize dividers. 6 sync modes: ticker, timeframe, crosshair, time, drawings, and indicators.
Templates & presets
Day trading, swing, crypto, and scalping templates. Save unlimited custom layouts with your indicators and drawings.
Live collaboration
End-to-end encrypted collaborative drawing, cloud sync across devices, shareable layout links, and pop-out panels for multi-monitor setups.
144,000+ symbols.
Zero tab-switching.
Stocks, crypto, and more from a single search bar. Extended-hours data included.
Stocks
US & global equities, ETFs, and indices with real-time and extended-hours data.
Crypto
Spot and perpetual pairs from leading exchanges, updated tick by tick.
Forex Coming Soon
Majors, minors, and exotics with deep historical depth for backtesting.
Futures Coming Soon
Index, energy, metals, and ag futures with continuous contract charts.
Free forever.
Pro when you outgrow the browser.
If it runs in your browser, it is free. If it needs a server, that is Pro. The free tier is not a crippled demo: every indicator, drawing tool, strategy builder and backtest is in it.
Everything you need to chart, build and backtest, with no account required.
- All 507 indicators and 90+ drawing tools
- 23 chart types and up to 16 chart panels
- Visual strategy builder and Python scripting
- Backtesting engine and unlimited bar replay
- Browser alerts, 28 widgets, AI assistant (Gemini)
- Broker live feed or 15-minute delayed data
Everything in Free, plus everything a browser alone cannot do:
- Auto trading: strategy signals execute as live broker orders, with running status, P&L and trade count per strategy
- Server-side backtesting: heavy multi-timeframe runs on server CPU with realistic fills, slippage and commissions
- Always-on alerts: fire with the tab closed, via push, email and HMAC-signed webhooks, including script and financial metric alerts
- TradeGrub live data feed: real-time US streaming with no broker needed, pre-market from 4 AM to 8 PM ET
- Server scripting: true multi-timeframe data access and server-fired script alerts
- 49 extra server-side pattern detectors on top of the 54 that run client-side
- Cloud sync of layouts, drawings, settings, templates and scripts across every device
- Sharing: short URLs, embed codes and marketplace publishing with revenue share
- AI upgrade: Claude and ChatGPT, higher limits, AI trade thesis and news sentiment heat layer
- Pro panels: Stock Picker, Relative Rotation, DOM order book, portfolio correlation, breadth indicators
- Live Collaborate for up to 500 participants with 12-hour sessions, plus priority support
For teams, brokers and platforms embedding our charts.
- White-label charting library
- Custom data sources, auth and storage providers
- SSO and deployment options
- Dedicated support and SLA
- Volume licensing
Cancel anytime, no lock-in: all free features keep working. See the full comparison on the TradeGrub Charts pricing page.
Questions,
answered.
Is TradeGrub Charts free to use?
Yes. The free tier is free forever and needs no credit card. It includes the charts, the 507 built-in indicators, the 90+ drawing tools, the visual strategy builder, Python scripting and backtesting. The rule is simple: if it runs in your browser it is free, and if it needs a server it is Pro.
What do I actually get with Pro?
Pro covers everything a browser cannot do on its own. Auto trading executes your strategy signals as live orders through a connected broker, with running status, P&L and trade count per strategy. Server-side backtesting runs heavy multi-timeframe tests on deep history with realistic fills, slippage and commissions. Alerts move to the server so they fire with the tab closed, delivered by push, email or HMAC-signed webhooks, including script alerts and financial metric alerts. You also get TradeGrub's own real-time US data feed with pre-market and after-hours coverage, server scripting with true multi-timeframe access, 49 additional server-side pattern detectors, cloud sync across devices, short-URL sharing, embed codes, marketplace publishing, an AI upgrade to Claude and ChatGPT, Pro panels such as Stock Picker, Relative Rotation and the DOM order book, and Live Collaborate for up to 500 participants. Cancel anytime, and every free feature keeps working. Compare plans.
Can I build a trading strategy without knowing how to code?
Yes. The visual strategy builder is a drag-and-drop node graph with seven palette categories covering 40+ indicator blocks, 19+ condition blocks and 14+ action blocks including stop loss, take profit, trailing stop and portfolio risk limits. Wiring nodes together produces a fully backtestable strategy with no code. Every graph also generates readable Python you can open and edit once you want to go further.
Does TradeGrub Charts support Python?
It runs real Python, not a lookalike scripting language. NumPy, Pandas and 90+ technical analysis functions execute inside a sandboxed WebAssembly runtime in your browser, so there is nothing to install and no API keys or servers to manage. Existing Pine scripts can be imported and converted, and a Pine-compatible interpreter runs them natively.
How much history can I backtest against?
Daily charts carry 20+ years of history with infinite scroll, and deep backtesting automatically fetches 15,000+ bars so intraday strategies are evaluated on a meaningful sample. Results include commission, slippage, spread and leverage modeling, plus Monte Carlo simulation, walk-forward optimization, parameter sweeps and a genetic optimizer.
Do I need to download or install anything?
No. Everything, including the Python runtime and the backtesting engine, runs in your browser. Charts also work on mobile and tablet with full touch support for drawing tools.
Which markets and data does TradeGrub Charts cover?
Real-time streaming for US stocks, ETFs and crypto, plus 15-minute delayed data for global markets. Extended hours data covers pre-market and after-hours sessions. You can also connect your own brokerage account and route chart data through your broker API with Bring Your Own Data. Forex and futures are on the roadmap.
Are there community indicators and strategies I can install?
Yes. Alongside the 507 built-in indicators and 46 pre-built strategies there is an open-source marketplace with 362 free community scripts: 272 indicators and 77 strategies. Install any of them in one click from the Marketplace tab, read or fork the source since every script is open-source, and publish your own scripts to share with the community.
Can I embed TradeGrub charts on my own website?
Yes. Embeddable widgets are available for mini charts, watchlists, ticker tapes, market movers, heatmaps, news, quotes, screeners, economic calendars and yield curves, alongside the full charting library for deeper integrations. See the widgets page for the full list.
Start charting in seconds
Join thousands of traders using TradeGrub™ Charts to analyze the markets. No download, no setup -- just open your browser.